AI Agents for DevOps: Architecture, SRE Incident Response, and Production Implementation
Master AI agents for DevOps. Learn how autonomous SRE agents investigate telemetry, slash MTTR by 70%, and automate Kubernetes remediation in Python.
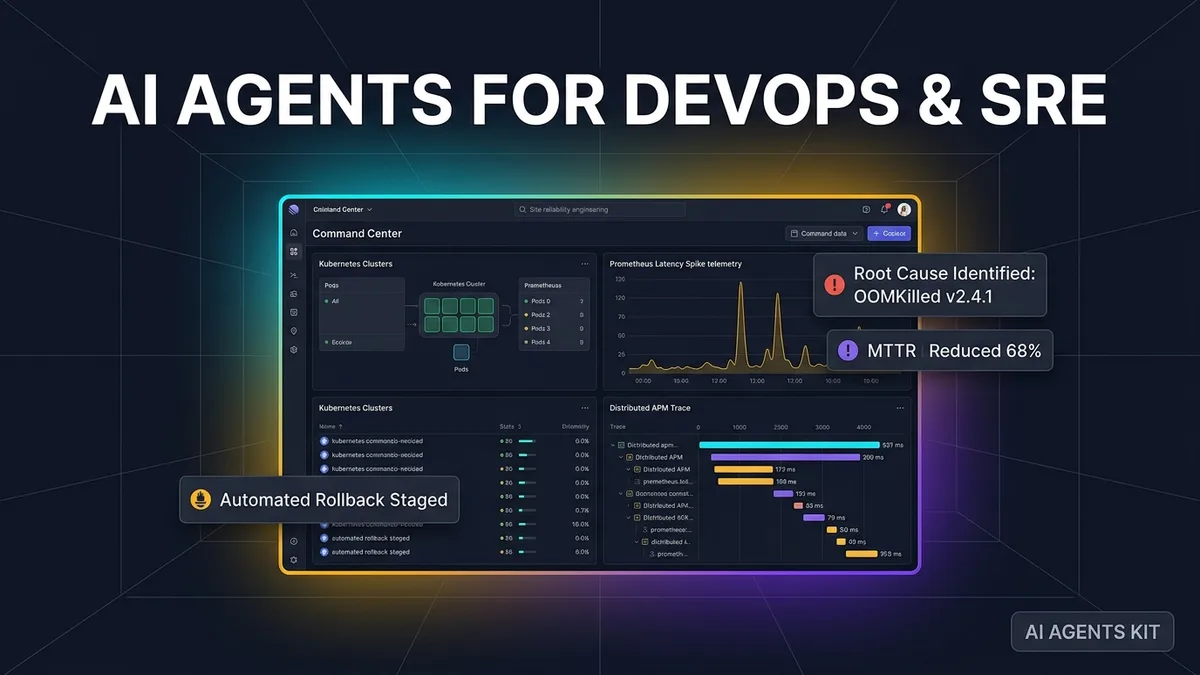
When production microservices fail at three in the morning, human on-call engineers spend upwards of forty-five minutes assembling dashboards, grepping container logs, and tracing latency waterfalls. Modern site reliability engineering teams deploy autonomous ai agents for devops to intercept firing alerts, form failure hypotheses against live telemetry, and execute policy-gated remediations in minutes.
Key Takeaways
- Autonomous SRE agents evolve beyond passive AIOps alert grouping by actively forming and testing failure hypotheses across distributed metrics, logs, and APM traces.
- Engineering teams deploying autonomous incident response report a 40% to 70% reduction in Mean Time to Resolution (MTTR), shrinking triage time from 45 minutes to under 3 minutes.
- Enterprise platforms enforce a 3-tier graduated autonomy model: Level 1 (Suggest RCA), Level 2 (Human-Approved Remediation), and Level 3 (Policy-Gated Autonomous Rollback).
- Production safety requires strict blast radius containment, combining least-privilege Kubernetes RBAC with automated circuit breakers to prevent rogue cluster modifications.
What Are AI Agents for DevOps and SRE?
An AI agent for DevOps is an autonomous system that interfaces with observability platforms, container orchestrators, and CI/CD pipelines to manage system reliability. Rather than waiting for human queries, the agent acts upon firing monitoring alerts to diagnose root causes and propose fixes.
Unlike static automation scripts, an SRE agent executes dynamic reasoning cycles over real-time telemetry. It inspects metrics in Prometheus, fetches distributed traces, and correlates error spikes with recent code deployments.
Engineering organizations deploy these agents directly into PagerDuty, Slack incident bridges, and Kubernetes clusters. This ensures every production degradation receives immediate investigative triage before on-call engineers even open their laptops.
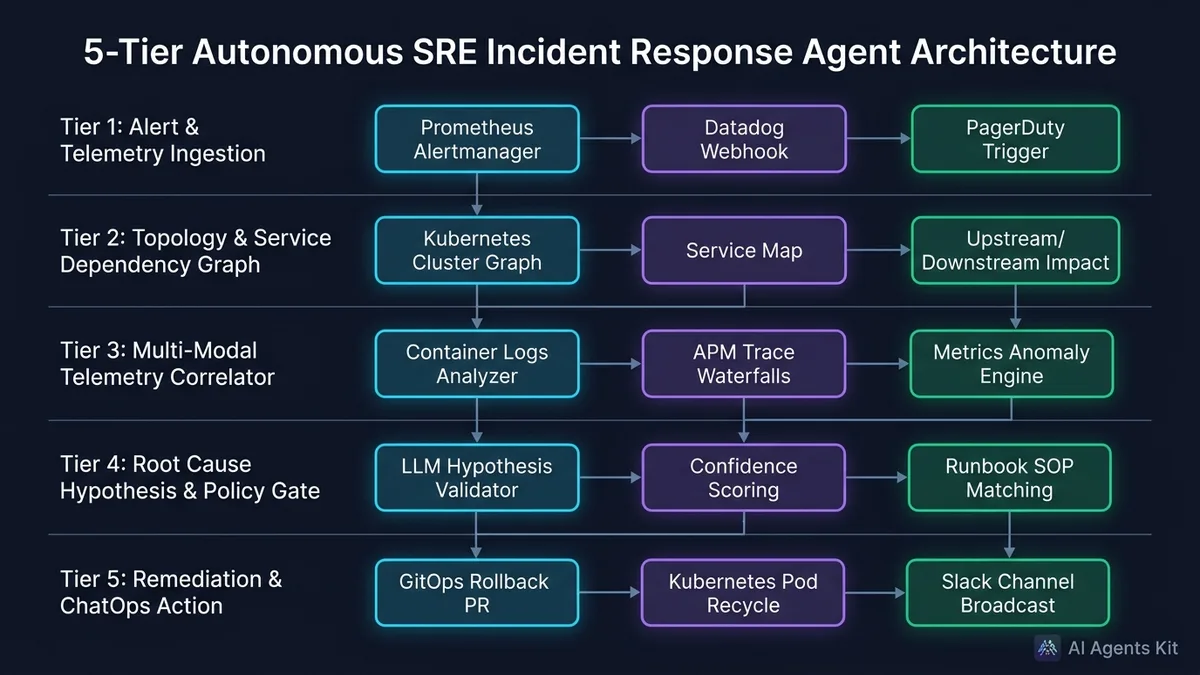
Figure 1: The 5-tier architecture of an autonomous SRE incident response agent pipeline.
From Passive AIOps to Autonomous Incident Investigation: The Core Paradigm Shift
First-generation AIOps platforms focused on statistical anomaly detection, deduplicating alerts, and clustering related monitoring notifications. While alert suppression reduced on-call noise, it did not resolve outages. Engineers still bore the cognitive burden of investigating the underlying failure mechanisms.
Autonomous incident agents shift the operational paradigm from passive alert clustering to active hypothesis verification. When an alert fires, the agent treats the incident as an empirical investigation. It inspects upstream and downstream dependencies, queries container logs, and formulates competing hypotheses regarding why the service degraded.
| Dimension | First-Generation AIOps | Static Runbook Automation | Autonomous SRE Agents |
|---|---|---|---|
| Core Operational Goal | Deduplicate and cluster alert notifications | Execute hardcoded sequential shell scripts | Investigate root causes and remediate anomalies |
| Telemetry Ingestion | Metadata timestamps and metric thresholds | Predefined trigger parameters | Full telemetry streams (metrics, logs, traces) |
| Investigation Method | Passive statistical correlation | None (Assumes predetermined failure mode) | Active hypothesis testing and graph traversal |
| Remediation Execution | Alerts human engineers via page | Executes fixed action regardless of context | Context-aware execution within policy guardrails |
| MTTR Impact | 10% to 15% reduction in alert triage | 20% to 30% reduction on known bugs | 40% to 70% reduction across complex outages |
This active investigation loop separates modern systems from brittle automated bash scripts. An agent understands system topology and recognizes when an apparent database failure is actually caused by upstream connection starvation.
The 5-Tier Architecture of an Autonomous SRE Incident Response Agent
Constructing a production-grade DevOps agent requires strict modularity between telemetry ingestion, hypothesis generation, and cluster execution layers. Modern systems implement five architectural tiers to maintain high investigative precision.
Tier 1: Alert and Telemetry Ingestion
The intake layer captures firing alerts from systems like Prometheus Alertmanager, Datadog Webhooks, or PagerDuty. The system extracts firing metric expressions, affected service tags, environment identifiers, and severity classifications. Implementing streamlined automated incident triage ensures incoming events receive immediate priority assignment before routing downstream.
Tier 2: Service Topology and Dependency Graph Traversal
Distributed cloud applications rarely fail in total isolation. The topology tier maps the affected service against the cluster dependency graph, identifying upstream API gateways and downstream databases. For coordinating multiple specialized agents, examine our guide on multi-agent systems architecture.
Tier 3: Multi-Modal Telemetry Correlator
The telemetry engine extracts data across three orthogonal observability pillars simultaneously. It pulls time-series metric anomalies from Prometheus, inspects container logs for unhandled exception stack traces, and analyzes distributed trace waterfalls to isolate latency bottlenecks. Connecting observability backends via the model context protocol devops standard enables secure, standardized tool interaction across heterogeneous cloud stacks.
Tier 4: Root Cause Hypothesis and Policy Gate
The reasoning engine formulates candidate failure hypotheses based on correlated telemetry patterns. The agent evaluates whether the outage stems from a memory leak, broken database index, third-party API outage, or configuration regression. Hypotheses scoring below an 85% confidence threshold are discarded to prevent hallucinated diagnoses.
Tier 5: Remediation and ChatOps Action Delivery
The execution engine transforms validated root causes into concrete remediation actions. Depending on the operational risk profile, the agent opens an incident briefing in Slack, generates a GitOps rollback pull request, or triggers a container restart via the Kubernetes workloads API.
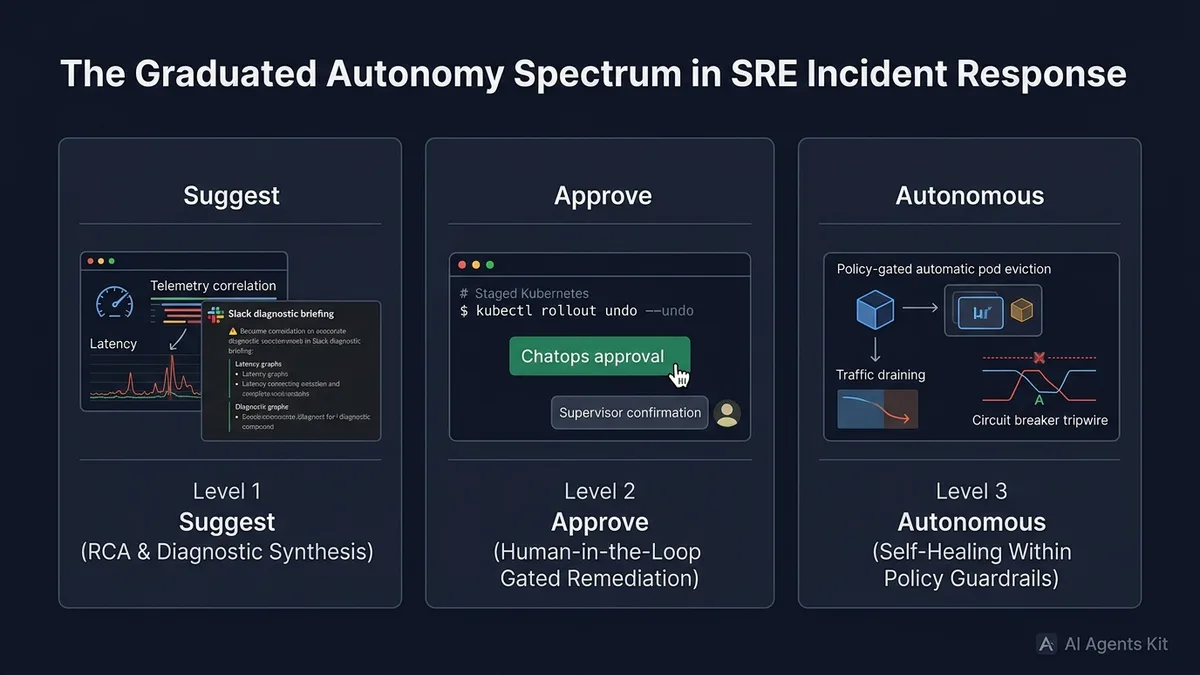
Figure 2: The graduated autonomy spectrum balancing automation speed with production safety.
The Graduated Autonomy Spectrum: From Suggested RCA to Self-Healing Workloads
Engineering leaders frequently hesitate to deploy autonomous infrastructure agents out of fear that an uncontrolled language model will delete production databases or drain active traffic. Production teams resolve this tension by implementing a graduated autonomy spectrum.
Level 1: Suggest (Root Cause Analysis & Diagnostic Synthesis)
In Level 1 environments, the agent possesses read-only access to monitoring systems. When an incident fires, the agent compiles an investigative dossier containing correlated logs, metric charts, and probable root causes. It posts this briefing into the incident Slack channel within three minutes, allowing human engineers to make remediation decisions with full context.
Level 2: Approve (Human-in-the-Loop Gated Remediation)
In Level 2 systems, the agent constructs the exact remediation command or GitOps pull request needed to restore service health. It posts the planned action into Slack with an interactive approval button. A human on-call engineer reviews the diagnostic rationale and clicks approve, prompting the agent to execute the action via authenticated APIs.
Level 3: Autonomous (Self-Healing Within Policy Guardrails)
In Level 3 deployments, the agent is granted autonomous remediation authority for well-understood, low-risk failure classes. Deploying a dedicated kubernetes ai remediation agent allows the platform to automatically restart CrashLooping stateless pods, drain degraded worker nodes, or scale replica sets during sudden traffic surges. Actions remain bounded by strict blast radius tripwires and rate limits.
The 3 Autonomy Tiers:
- Level 1 (Suggest): Read-only diagnostics, hypothesis formulation, Slack briefings.
- Level 2 (Approve): Prepared shell commands, ChatOps approval gates, human sign-off.
- Level 3 (Autonomous): Automated rollbacks, pod recycling, policy-gated self-healing.
Teams progress through these tiers sequentially. Most organizations begin at Level 1 for 60 days to benchmark diagnostic accuracy before graduating specific runbooks to Level 2 and Level 3.
Enterprise Platform Comparison: Datadog Bits AI vs PagerDuty SRE Agent vs Komodor
Engineering organizations evaluating commercial solutions choose between platform-native observability assistants, incident response orchestrators, and Kubernetes troubleshooting specialists.
1. Datadog (Bits AI SRE)
Datadog Bits AI operates natively within Datadog’s extensive telemetry database. Bits AI analyzes APM distributed trace waterfalls, infrastructure metrics, and synthetic monitors. It correlates live production incidents with linked Confluence runbooks and GitHub pull requests. It is the primary choice for organizations whose observability stack is already fully consolidated in Datadog.
2. PagerDuty (SRE Agent)
PagerDuty’s SRE Agent focuses on the incident lifecycle, team orchestration, and cross-platform context synthesis. Rather than living within a single monitoring tool, PagerDuty connects Datadog, Grafana, AWS CloudWatch, and GitHub into a unified incident thread. It joins the on-call Slack channel pre-armed with diagnostic data and executes runbook automations directly from the chat interface.
3. Komodor
Komodor is engineered specifically for Kubernetes cluster operations. It excels at diagnosing complex container failure modes like OOMKilled errors, CrashLoopBackOff states, image pull failures, and misconfigured network policies. Komodor inspects cluster event streams and traces historical deployment changes to explain why a pod became unhealthy.
| Platform | Telemetry Ingestion Engine | Root Cause Methodology | Remediation Stance | Deployment Model | Ideal Production Fit |
|---|---|---|---|---|---|
| Datadog Bits AI | Native Datadog metrics, APM, and logs | Correlates trace waterfalls and runbooks | Suggests fixes and drafts code patches | SaaS (Datadog Platform) | Teams with full Datadog observability consolidation |
| PagerDuty SRE Agent | Multi-vendor connectors (Datadog, AWS, GitHub) | Historical incident matching and alert context | Triggers pre-approved PagerDuty runbooks | SaaS (Multi-Cloud) | Enterprise teams managing heterogeneous monitoring stacks |
| Komodor | Kubernetes API, cluster events, and Helm | Cluster topology and resource graph analysis | Automated Kubernetes pod and node actions | SaaS and Hybrid Agent | Organizations managing high-density Kubernetes fleets |
| Custom LangGraph Agent | OpenTelemetry, Prometheus, and Loki | Cyclic hypothesis testing with local LLMs | Fully customizable API and CLI tool calling | Self-Hosted in Private VPC | Security-sensitive teams requiring zero data egress |
Root Cause Analysis Across Logs, Metrics, and Distributed Traces
Achieving meaningful mttr reduction ai agents requires diagnosing failures across all three observability pillars rather than relying on log search alone. Each telemetry format provides a distinct piece of the diagnostic puzzle.
Time-series metrics provide the temporal anchor of an incident. Spikes in CPU utilization, memory consumption, or HTTP $5xx$ status error rates establish the exact second an outage began. The agent uses metric inflection points to define the diagnostic search window for subsequent queries.
Container logs reveal concrete error signatures. Once the temporal window is bounded, the agent extracts unhandled exception stack traces, database connection timeouts, and authentication failures. Modern agents filter repetitive log noise to isolate the initial fatal exception that triggered the cascading failure.
Distributed APM traces provide structural context across microservice network boundaries. When an API endpoint experiences severe latency spikes, distributed trace spans reveal whether the slowdown occurred within application code, a downstream payment gateway, or an unindexed SQL query. For automated code auditing standards that prevent these regressions, inspect our guide on AI agents for code review.
[!TIP] Always correlate incident timestamps with recent deployment events and feature flag toggles. Over 75% of production outages are triggered by recent code deployments rather than random infrastructure hardware failures.
Step-by-Step Implementation: Building a LangGraph SRE Incident Agent in Python
Building a custom SRE agent gives platform teams complete control over cluster permissions, internal runbooks, and security boundaries. We will build a production langgraph sre agent using LangGraph and Pydantic. For evaluating agent orchestration patterns, see our architectural comparison of PydanticAI vs LangChain vs LangGraph.
This architecture ingests a Prometheus alert, inspects pod logs, generates a root cause diagnosis, and uses the LangGraph interrupt() primitive to gate a Kubernetes rollback behind human supervisor approval.
import asyncio
from typing import List, Optional, Literal
from enum import Enum
from pydantic import BaseModel, Field
from typing_extensions import TypedDict
from langgraph.types import interrupt, Command

# ==============================================================================
# 1. Structured Data Schemas
# ==============================================================================

class AlertSeverity(str, Enum):
    CRITICAL = "critical"
    WARNING = "warning"
    INFO = "info"

class DiagnosticFinding(BaseModel):
    service_name: str = Field(description="Target microservice name")
    root_cause_summary: str = Field(description="Synthesized root cause diagnosis")
    confidence_score: float = Field(ge=0.0, le=1.0, description="Confidence rating")
    suggested_action: str = Field(description="Remediation command or runbook step")

class SREIncidentState(TypedDict):
    incident_id: str
    alert_name: str
    service_name: str
    severity: AlertSeverity
    prometheus_metrics: dict
    container_logs: List[str]
    diagnostic_result: Optional[DiagnosticFinding]
    remediation_approved: bool
    remediation_status: str

# ==============================================================================
# 2. Agent Graph Nodes
# ==============================================================================

async def telemetry_intake_node(state: SREIncidentState) -> dict:
    """
    Ingests Prometheus metrics and simulates container log retrieval.
    """
    # Simulated Prometheus metric data
    metrics = {
        "cpu_usage_percent": 94.2,
        "memory_usage_mb": 2048,
        "memory_limit_mb": 2048,
        "restart_count": 5,
        "error_rate_percent": 18.4
    }

    # Simulated pod logs showing OOMKilled pattern
    logs = [
        "2026-10-06 22:14:01 INFO Server listening on port 8080",
        "2026-10-06 22:14:15 WARN Memory threshold exceeded: 1950MB / 2048MB",
        "2026-10-06 22:14:18 ERROR java.lang.OutOfMemoryError: Java heap space",
        "2026-10-06 22:14:19 FATAL Container terminated by signal 9 (OOMKilled)"
    ]

    return {
        "prometheus_metrics": metrics,
        "container_logs": logs
    }

async def root_cause_reasoning_node(state: SREIncidentState) -> dict:
    """
    Synthesizes metrics and logs into a verified root cause hypothesis.
    """
    logs = state["container_logs"]
    metrics = state["prometheus_metrics"]

    # Deterministic pattern matching combined with semantic analysis
    has_oom = any("OutOfMemoryError" in line or "OOMKilled" in line for line in logs)

    if has_oom and metrics["memory_usage_mb"] >= metrics["memory_limit_mb"]:
        finding = DiagnosticFinding(
            service_name=state["service_name"],
            root_cause_summary="Memory leak in recent release v2.4.1 triggered pod OOMKilled crashloop.",
            confidence_score=0.96,
            suggested_action="kubectl rollout undo deployment/order-service -n production"
        )
    else:
        finding = DiagnosticFinding(
            service_name=state["service_name"],
            root_cause_summary="Transient CPU saturation detected during database sync cycle.",
            confidence_score=0.82,
            suggested_action="Scale deployment replicas from 3 to 6."
        )

    return {"diagnostic_result": finding}

async def remediation_approval_gate_node(state: SREIncidentState) -> dict:
    """
    Enforces human-in-the-loop approval before executing cluster state changes.
    """
    finding = state["diagnostic_result"]

    # Level 2 Autonomy: Interrupt execution to require on-call engineer sign-off
    approval_payload = interrupt({
        "incident_id": state["incident_id"],
        "service": state["service_name"],
        "proposed_command": finding.suggested_action,
        "rationale": finding.root_cause_summary,
        "confidence": finding.confidence_score
    })

    # Execution resumes here when supervisor provides input via Command(resume=...)
    is_approved = bool(approval_payload.get("approved", False))
    return {"remediation_approved": is_approved}

async def remediation_execution_node(state: SREIncidentState) -> dict:
    """
    Executes the approved remediation action via Kubernetes API client.
    """
    if state["remediation_approved"]:
        action = state["diagnostic_result"].suggested_action
        # In production, this executes the command via official Kubernetes Python SDK
        status_msg = f"Successfully executed: {action}. Monitoring service recovery."
    else:
        status_msg = "Remediation rejected by human on-call engineer. Escalating to primary SRE lead."

    return {"remediation_status": status_msg}

# ==============================================================================
# 3. Execution Pipeline Runner
# ==============================================================================

async def main():
    initial_state: SREIncidentState = {
        "incident_id": "INC-8912",
        "alert_name": "KubePodCrashLooping",
        "service_name": "order-service",
        "severity": AlertSeverity.CRITICAL,
        "prometheus_metrics": {},
        "container_logs": [],
        "diagnostic_result": None,
        "remediation_approved": False,
        "remediation_status": ""
    }

    # Step 1: Ingest telemetry
    intake_res = await telemetry_intake_node(initial_state)
    initial_state.update(intake_res)

    # Step 2: Formulate root cause diagnosis
    rca_res = await root_cause_reasoning_node(initial_state)
    initial_state.update(rca_res)

    # Step 3: Simulate human approval in Level 2 autonomy
    # In live production, LangGraph checkpointer pauses until Slack button is pressed
    initial_state["remediation_approved"] = True

    # Step 4: Execute remediation action
    exec_res = await remediation_execution_node(initial_state)
    initial_state.update(exec_res)

    print("=== Automated Incident Triage Summary ===")
    print(f"Incident ID: {initial_state['incident_id']}")
    print(f"Root Cause:  {initial_state['diagnostic_result'].root_cause_summary}")
    print(f"Confidence:  {initial_state['diagnostic_result'].confidence_score * 100:.1f}%")
    print(f"Action:      {initial_state['remediation_status']}")

if __name__ == "__main__":
    asyncio.run(main())
This LangGraph script establishes a resilient boundary between automated diagnosis and production state modification. Teams can connect this logic to Slack or incident management webhooks to coordinate responses across the engineering organization.
Complete Production Skill: The SRE Incident Commander Runbook
An SRE agent skill is an executable operational instruction package that equips AI coding assistants and autonomous workers with standardized incident management procedures. Installing this modular skill into your agent workspace guarantees consistent, deterministic incident investigations. For an architectural breakdown of agent skills, review our comprehensive tutorial on Claude Agent Skills.
Copy the following specification into your workspace at .claude/skills/sre-incident-commander/SKILL.md or .agents/skills/sre-incident-commander/SKILL.md.
---
name: sre-incident-commander
description: Autonomous SRE incident response and DevOps troubleshooting skill. Ingests monitoring alerts, correlates metrics and APM traces across service dependency graphs, performs root cause analysis, generates runbook remediation plans, and executes policy-gated rollbacks with human approval. Use when asked to triage incidents, debug production outages, analyze Kubernetes telemetry, or automate SRE runbooks.
---

# SRE Incident Commander Runbook

This skill equips the agent to act as a principal site reliability engineer (SRE) leading production incident response. When activated, follow this systematic 5-stage triage and remediation process.

## Stage 1: Incident Intake and Blast Radius Assessment

Before executing any commands, parse the incoming alert trigger and bound the failure surface:

1. **Alert Ingestion:** Identify firing service name, environment (Production, Staging), severity tier (P1/P2/P3), and trigger timestamp.
2. **Topology Discovery:** Map upstream caller services and downstream database or caching dependencies using the service dependency graph.
3. **Blast Radius Measurement:** Determine the percentage of user traffic impacted, error rate magnitude ($5xx$ percentage), and latency divergence.
4. **Responder Declaration:** Post a standardized initial status update to the incident Slack channel declaring the active investigation lead.

## Stage 2: Multi-Modal Telemetry Correlation

Gather telemetry across logs, metrics, and traces simultaneously to isolate anomalies:

- **Metrics Inspection:** Query Prometheus or Datadog for CPU saturation, memory exhaustion (OOM), connection pool exhaustion, or I/O wait spikes.
- **Log Anomaly Parsing:** Fetch the last 200 error log lines matching the service container or pod; extract unhandled exceptions and stack traces.
- **APM Distributed Traces:** Trace $p99$ latency spikes to identify whether bottlenecks stem from downstream external APIs, unindexed database queries, or internal thread deadlocks.
- **Deployment Correlation:** Check git commit logs and CI/CD pipelines for deployments or feature flag changes within the last 60 minutes.

## Stage 3: Root Cause Hypothesis Formulation

Synthesize telemetry findings into ranked failure hypotheses:

- **Hypothesis Ranking:** Formulate the top 2 most probable failure mechanisms backed by concrete metric timestamps and stack traces.
- **Evidence Verification:** Confirm hypotheses against known error patterns (e.g., memory leak triggering pod OOMKilled, database connection starvation, or breaking schema migration).
- **Rule Out Confounders:** Explicitly rule out benign side effects (e.g., elevated CPU caused by retry storms from an already-dead database).

## Stage 4: Runbook Remediation Execution (Graduated Autonomy)

Execute remediation actions strictly adhering to graduated autonomy standards:

### 1. Level 1 (Suggest RCA)
- For unknown defects or complex application logic bugs, output diagnostic findings and provide engineering leads with actionable remediation options.

### 2. Level 2 (Human-in-the-Loop Gated Actions)
- For high-impact actions like rolling deployment rollbacks (`kubectl rollout undo`) or database read-replica promotions, prepare the exact shell command and pause for supervisor sign-off.

### 3. Level 3 (Autonomous Policy-Gated Remediation)
- For low-risk, pre-approved runbooks (restarting a CrashLooping stateless pod or draining a degraded node), execute the command automatically and verify health recovery.

## Stage 5: Verification and Postmortem Synthesis

Confirm service stabilization and document the incident lifecycle:

- **Recovery Verification:** Monitor error rates and latency metrics for 5 consecutive minutes to confirm return to baseline.
- **Incident Channel Closeout:** Broadcast the resolution summary, total duration, and initial root cause to stakeholders.
- **Automated Postmortem Generation:** Generate a blameless postmortem artifact documenting detection time, resolution timeline, root cause analysis, and preventative action items.
Installing this runbook enables developer assistants to execute repeatable, disciplined incident investigations across all microservice tiers.
Production Guardrails, Blast Radius Containment, and Failure Modes
Deploying autonomous systems with infrastructure modification privileges introduces catastrophic risk if proper safety constraints are neglected.
1. Rogue Remediation Spirals and Cascading Failures
If an AI agent possesses unrestricted authority to restart unhealthy services, a database outage can cause the agent to restart every dependent microservice simultaneously. This thundering herd triggers cascading failures across the entire cluster. Prevent this by enforcing global cooldown timers and limiting automated pod restarts to no more than one per five-minute window.
2. Least-Privilege Kubernetes RBAC
Never grant an AI agent cluster-admin privileges. Restrict the agent’s Kubernetes ServiceAccount to specific namespaces and read-only verbs (get, list, watch) for logs and pod states. For write operations, limit permissions exclusively to patch verbs on specific deployment workloads.
3. Hallucinated Root Causes in Novel Failure Modes
When confronted with unprecedented failure patterns, language models may fabricate plausible-sounding root cause explanations that distract on-call engineers. Enforce evidentiary grounding: every claim in an agent’s diagnosis must cite a specific metric timestamp, log line number, or trace span ID.
"Engineering organizations deploying autonomous SRE agents report a 40% to 70% reduction in Mean Time to Resolution (MTTR), shrinking diagnostic investigation time from 45 minutes to under 3 minutes." - State of Autonomous SRE & Observability Benchmark Report
Frequently Asked Questions About AI Agents for DevOps
How do AI agents for DevOps investigate live production incidents?
When an alert fires, the agent queries telemetry data across Prometheus metrics, distributed APM traces, and container log streams simultaneously. It correlates anomalies against recent deployment commits and service dependency graphs to generate a ranked root cause diagnosis within minutes.
What is the difference between traditional AIOps and autonomous SRE agents?
Traditional AIOps focuses passively on alert noise reduction and grouping disparate monitoring signals into unified incidents. Autonomous SRE agents actively query live systems, execute diagnostic commands, formulate failure hypotheses, and execute policy-gated remediations.
Can an AI agent safely execute remediation commands in production Kubernetes clusters?
Organizations enforce safe execution by restricting autonomous actions to low-risk, pre-approved runbooks like rolling pod restarts or traffic draining. High-impact operations such as database rollbacks or infrastructure teardowns mandate explicit human supervisor sign-off via chatops approval gates.
How do Datadog Bits AI and PagerDuty SRE Agent compare?
Datadog Bits AI specializes in deep native telemetry analysis, correlating APM traces, synthetic monitors, and linked Confluence runbooks inside Datadog. PagerDuty SRE Agent operates as an omnichannel incident orchestrator, coordinating cross-platform integrations across Slack, GitHub, Datadog, and AWS.
How much does deploying an autonomous SRE agent reduce MTTR?
Production engineering teams report between 40% and 70% reductions in Mean Time to Resolution after deploying autonomous incident agents. By automating data collection and hypothesis verification, agents compress the investigative phase from 45 minutes down to under 3 minutes.