Production AI Agent Observability: Complete Distributed Tracing & Telemetry Architecture
The definitive enterprise blueprint for AI agent observability. Learn causal DAG tracing, OpenTelemetry semantic conventions, tail sampling, and ClickHouse storage.
Deploying autonomous AI agents into mission-critical production environments requires an operational shift. In deterministic software systems, application health is adequately measured by HTTP status codes, CPU saturation, and database transaction latencies. In contrast, agentic systems operate through non-deterministic reasoning loops, multi-turn tool calling, dynamic prompt composition, and asynchronous sub-agent delegation.
When an autonomous agent degrades, traditional monitoring systems fail completely. An agent can execute fifty sequential operations, return a series of HTTP 200 responses, and still fail its primary operational objective due to context window saturation, tool parameter hallucination, or circular reasoning drift. As teams discover when monitoring AI agent performance, debugging agentic failures requires specialized distributed telemetry capable of recording causal directed acyclic graphs (DAGs) across extended execution horizons.
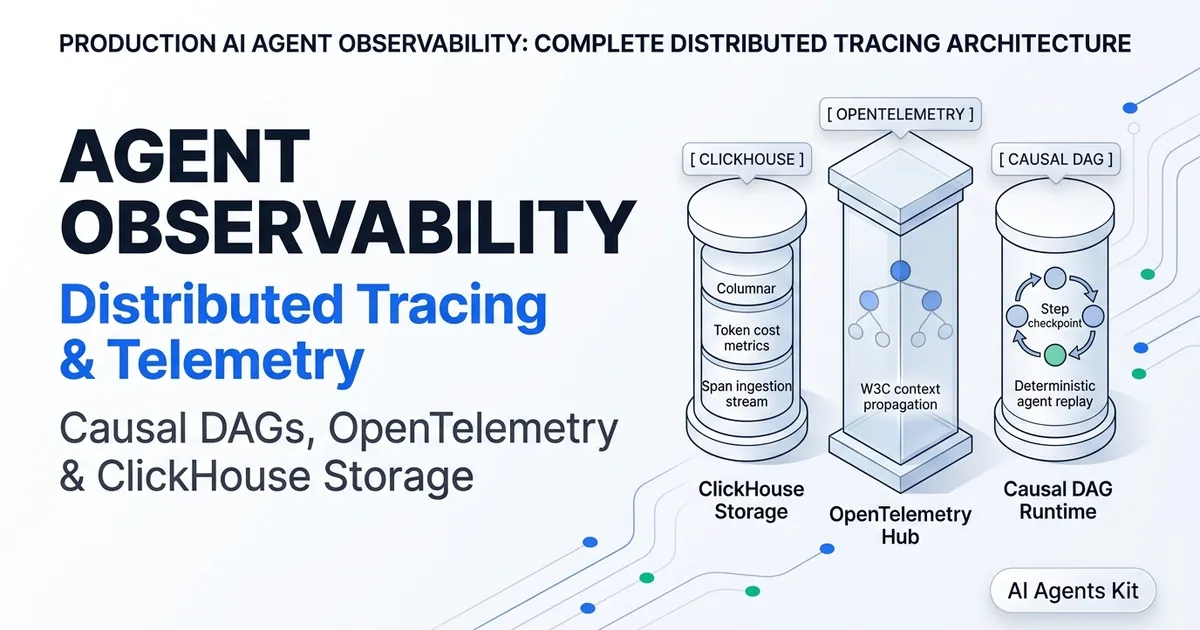
This comprehensive architectural guide provides the definitive blueprint for engineering enterprise-grade AI agent observability. We examine the core telemetry data model, W3C trace context propagation across asynchronous swarms, high-throughput ClickHouse ingestion pipelines, intelligent tail-based sampling, and multi-tenant FinOps enforcement.
Key Takeaways
- Causal DAG Hierarchies: Effective agent observability replaces flat log strings with nested parent-child span graphs that link high-level user intents directly to sub-agent delegations and granular tool parameters.
- Vendor-Neutral Standardization: Standardizing telemetry on OpenTelemetry GenAI semantic conventions prevents proprietary vendor lock-in and allows trace federation across enterprise APM collectors.
- High-Throughput Decoupled Storage: Production telemetry architectures buffer trace spans through Redis queues before executing vectorized batch flushes into ClickHouse columnar MergeTree engines.
- Intelligent Tail Sampling: Implementing tail-based sampling retains 100% of failed agent runs and high-latency anomalies while sampling nominal completions at 5%, reducing storage costs by up to 78%.
Why Traditional APM Systems Fail for Autonomous AI Agents
What fundamental limitations prevent traditional application performance monitoring tools from debugging autonomous agents?
Direct Answer: Traditional APMs monitor synchronous request-response lifecycles and HTTP status codes, which cannot capture non-deterministic reasoning loops, cumulative semantic drift, or cascading tool failures. They lack semantic primitives to quantify context window inflation, prompt versions, or multi-turn token costs.
Over 73% of production multi-agent system failures stem from cascaded reasoning drift and unobserved tool state corruption rather than infrastructure network timeouts. Traditional APM platforms treat external API calls as isolated, stateless spans.
When an agent calls an external LLM API three times in five seconds, standard monitoring records three discrete outbound HTTP requests. It never records how the output of turn one influenced the tool selection in turn three.
Furthermore, traditional APMs suffer from four systemic blind spots in agentic architectures:
- No Semantic Context: APMs do not inspect prompt templates or vector context, obscuring model hallucination.
- Missing Token Economics: Standard monitors track wall-clock duration without attributing prompt tokens to customer accounts.
- Flat Span Models: Cyclic agent architectures generate recursive execution graphs that distort standard microservice traces.
- Inability to Diagnose Silent Failures: When a model hallucinates an apology after tool errors, standard APMs record HTTP 200 success.
The Four Primitives of AI Agent Telemetry: Traces, Spans, Generations, and Observations
What foundational data primitives are required to accurately model autonomous agent executions?
Direct Answer: Modern AI agent telemetry builds upon four hierarchical primitives: Traces representing the end-to-end user goal, Spans capturing discrete execution stages, Generations tracking foundation model inferences, and Observations recording tool inputs and environment feedback.
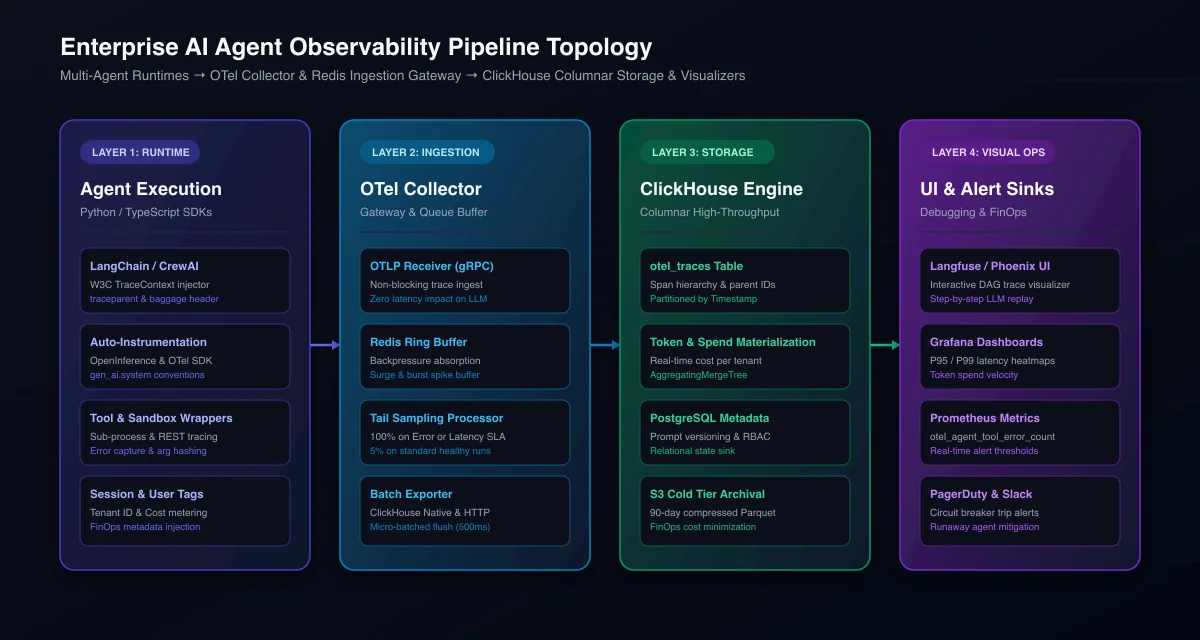 Figure 1: Comprehensive enterprise AI agent observability architecture illustrating client instrumentation, streaming buffers, columnar storage, and evaluation gates.
To model non-deterministic workflows cleanly, modern observability frameworks structure telemetry data into four distinct semantic layers:
1. The Root Trace
The Trace represents the overarching business transaction or user goal (for example, “Process Customer Insurance Claim #4491”). The trace encapsulates global metadata, including the authenticated userId, a persistent sessionId, tenant tier identifiers, release versions, and overall execution status. All subsequent agent operations inherit these root tags.
2. Execution Spans
Spans represent non-LLM operational phases within the agent lifecycle. Common examples include input prompt sanitization, vector database similarity retrieval, local Python script execution, and output JSON schema validation. Spans capture start timestamps, end timestamps, error stacks, and custom attributes.
3. Model Generations
Generations are specialized spans tailored specifically to foundation model inferences. In addition to standard timing attributes, Generations capture prompt messages, completion strings, model identifiers (model="gpt-4o"), temperature settings, token usage metrics (prompt, completion, cache read), and calculated monetary costs.
4. Observations and Tool Feedback
Observations capture the interactions between the agent and its external environment. When an agent invokes a database query tool or reads an API payload, the Observation records the serialized function name, the arguments passed by the model, the raw text returned by the tool, and whether the tool output resulted in a validation exception.
Distributed Context Propagation: Linking Asynchronous Multi-Agent Swarms
How do distributed telemetry systems maintain unbroken trace graphs across asynchronous worker agents and message brokers?
Direct Answer: Context propagation uses W3C Trace Context standards (
traceparentandtracestateheaders) injected into message payloads and HTTP requests. As asynchronous sub-agents consume tasks from queues, they extract this header to link their execution spans directly to the parent trace.
In sophisticated enterprise systems, autonomous swarms rarely execute inside a single Python process. A supervisor agent running on an API server frequently delegates tasks to background worker pods via message brokers like Kafka, RabbitMQ, or Celery.
If a worker process executes without inheriting trace context, its telemetry generates a disconnected root trace, destroying visibility into which supervisor request triggered the work. Standardizing context propagation requires implementing the formal W3C Trace Context Specification across all process boundaries.
import json
from typing import Any, Dict
from opentelemetry import trace
from opentelemetry.trace.propagation.tracecontext import TraceContextTextMapPropagator

tracer = trace.get_tracer("enterprise-agent-supervisor")
propagator = TraceContextTextMapPropagator()

def dispatch_subagent_task(task_payload: Dict[str, Any], queue_client: Any) -> None:
    """
    Supervisor node that creates an active span, injects W3C traceparent
    headers into the message body, and enqueues the task for workers.
    """
    with tracer.start_as_current_span("supervisor.dispatch_task") as span:
        carrier: Dict[str, str] = {}
        # Inject current traceparent (trace_id, span_id, trace_flags) into carrier dictionary
        propagator.inject(carrier)

        message = {
            "task_data": task_payload,
            "telemetry_context": carrier
        }

        span.set_attribute("agent.supervisor.task_id", task_payload["id"])
        span.set_attribute("agent.supervisor.queue", "agent-worker-tasks")

        queue_client.publish(
            routing_key="agent-worker-tasks",
            body=json.dumps(message)
        )

def process_worker_task(raw_message: str) -> None:
    """
    Worker node that consumes the message, extracts the parent trace context,
    and executes sub-agent logic under the unified trace graph.
    """
    message = json.loads(raw_message)
    carrier = message.get("telemetry_context", {})

    # Extract parent context from the carrier dictionary
    parent_context = propagator.extract(carrier)

    # Start worker span as a direct child of the supervisor span
    with tracer.start_as_current_span("worker.execute_subtask", context=parent_context) as span:
        span.set_attribute("agent.worker.id", "worker-pod-04")
        task_id = message["task_data"]["id"]
        span.set_attribute("agent.worker.task_id", task_id)

        # Execute sub-agent reasoning loop...
        execute_subagent_reasoning_step(message["task_data"])
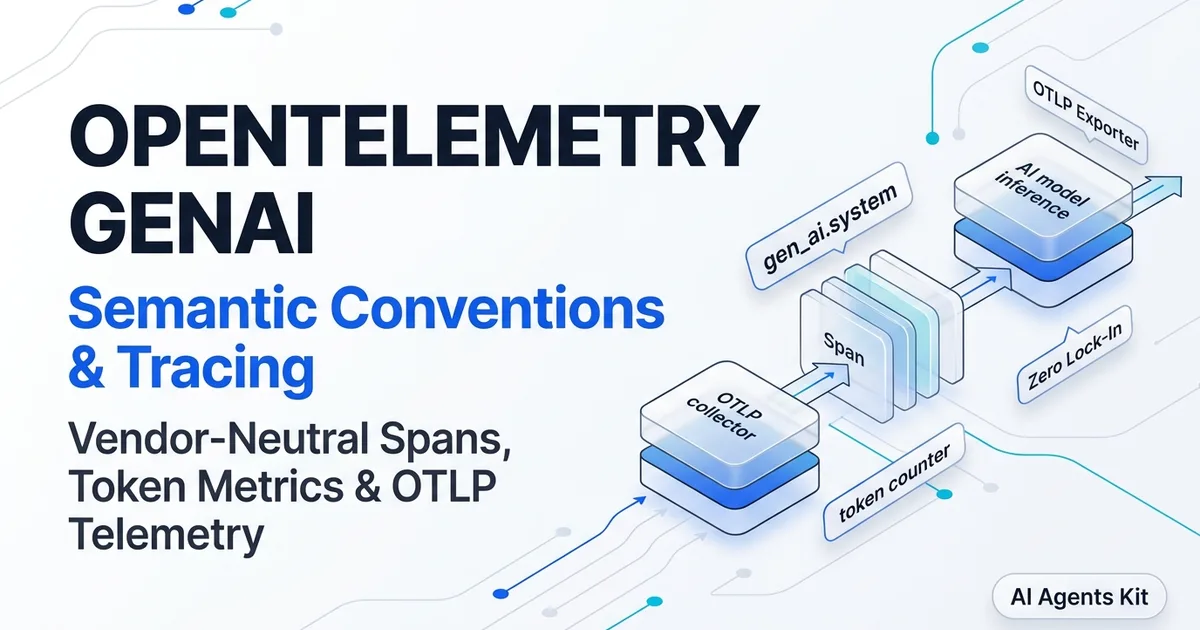
By leveraging standard W3C propagators, spans created inside background worker containers nest perfectly under the supervisor’s root trace. Adhering to the official OpenTelemetry GenAI Semantic Conventions ensures that span names and token counters map cleanly across vendor collectors. To implement standardized semantic keys in Python, follow our step-by-step OpenTelemetry GenAI semantic conventions guide.
Causal DAG Tracing: Diagnosing Recursive Reasoning Loops and Cascading Tool Failures
How does causal DAG visualization enable engineers to pinpoint the exact failure point in multi-step agent reasoning?
Direct Answer: Causal DAG tracing visualizes the directed acyclic graph of agent execution, explicitly linking each model reasoning turn to the resulting tool parameters and subsequent observations. This allows engineers to identify early hallucinations that trigger late-stage failures.
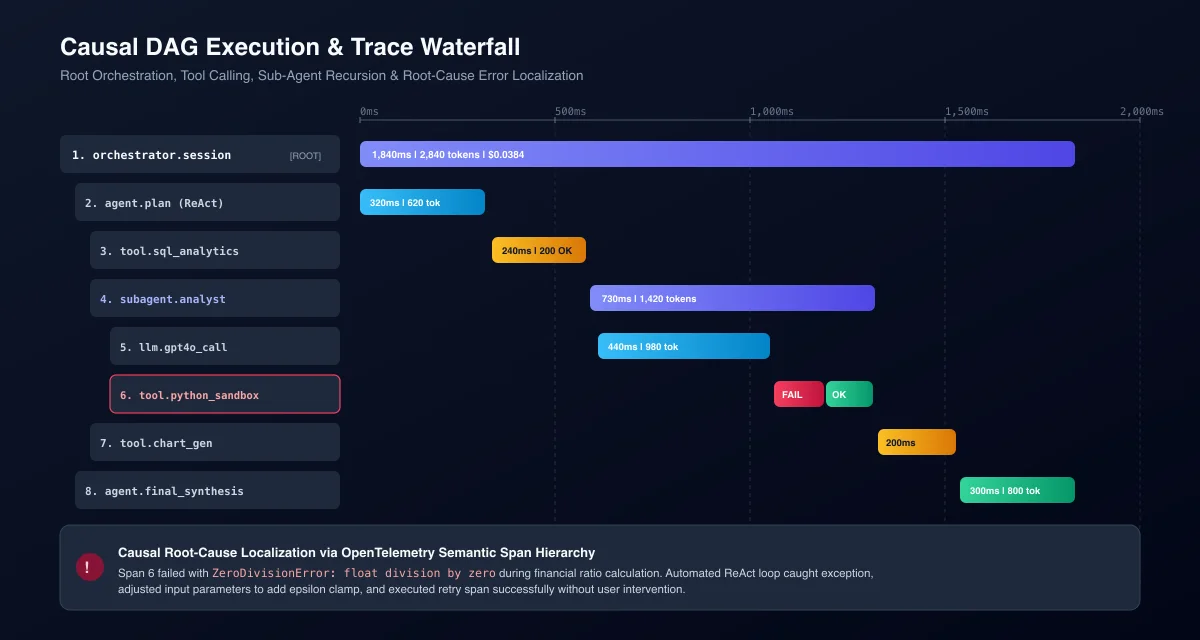 Figure 2: Causal DAG waterfall architecture illustrating multi-agent supervisor delegation, tool execution cascades, and root-cause error localization.
In complex agent workflows, failures rarely manifest at the point of origin. Instead, errors propagate through a causal chain across multiple reasoning turns:
- Turn 1 (Subtle Hallucination): The agent invokes an inventory search tool with a slightly malformed SKU filter (
filter="SKU-990-NULL"). - Turn 2 (Ambiguous Observation): The tool returns an empty list (
[]) without raising an error. The model interprets this as “Item out of stock” rather than “Invalid query syntax”. - Turn 3 (Reasoning Drift): The model attempts an alternative workflow, querying a supplier API using unvalidated assumptions.
- Turn 4 (Catastrophic Failure): The supplier API rejects the request with an authorization exception, causing the entire customer workflow to abort.
In a flat log file, an engineer reviewing the Turn 4 exception would waste hours troubleshooting supplier API permissions. With a causal DAG waterfall, the engineer traces backward from the final error directly to the initial malformed query at Turn 1.
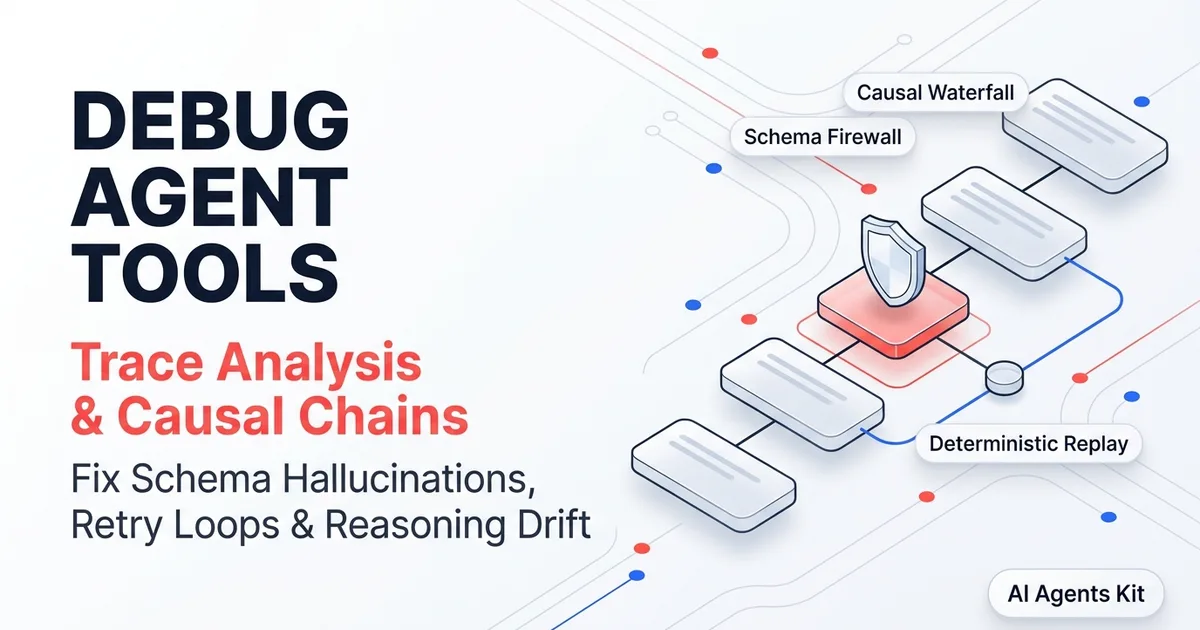
When diagnosing cascading tool failures and schema mismatches in your production agents, follow our dedicated operational walkthrough on debugging multi-step agent tool call failures.
Production Ingestion Pipeline: In-Memory Buffers and Columnar ClickHouse Storage
What infrastructure topology is required to ingest millions of high-velocity agent traces per day without degrading inference latency?
Direct Answer: A production ingestion pipeline pairs lightweight asynchronous client SDKs with streaming Redis buffer queues and ClickHouse columnar storage. This architecture decouples synchronous application inference from analytical database writes, supporting massive span ingestion with sub-millisecond client dispatch.
High-throughput generative AI platforms generate staggering volumes of telemetry data. A single user conversation with a multi-step agent can generate forty individual spans containing extensive prompt passages, tool arguments, and raw token counters.
Writing telemetry spans synchronously to an operational database like PostgreSQL or MongoDB during user request cycles degrades end-user latency and introduces connection pool exhaustion.
The proven architecture for high-volume agent observability relies on a decoupled, three-tier data pipeline:
[Agent Client SDK] ──(HTTP/Protobuf)──> [Ingestion API Gateway]
                                                │
                                       [In-Memory Redis Stream]
                                                │
                                    [Background Bulk Flusher]
                                                │
                                     [ClickHouse MergeTree]
1. The Ingestion API Gateway
The gateway is a lightweight stateless service written in Go or Node.js. It authenticates incoming client payloads against cached project keys and immediately appends the raw span records into an in-memory Redis stream, responding to the client in under 2ms.
2. Redis Stream Buffering
Redis acts as a high-capacity shock absorber during sudden traffic spikes. If a marketing event causes ten thousand users to invoke agents simultaneously, Redis buffers the ingestion queue without dropping packets or stressing backend storage.
3. ClickHouse Vectorized Batch Ingestion
A pool of dedicated ingestion workers consumes spans from Redis in batches of 5,000 to 10,000 events. The workers execute bulk inserts into ClickHouse using the table structures documented in the ClickHouse ReplacingMergeTree Documentation, which deduplicates spans based on trace ID and span ID.
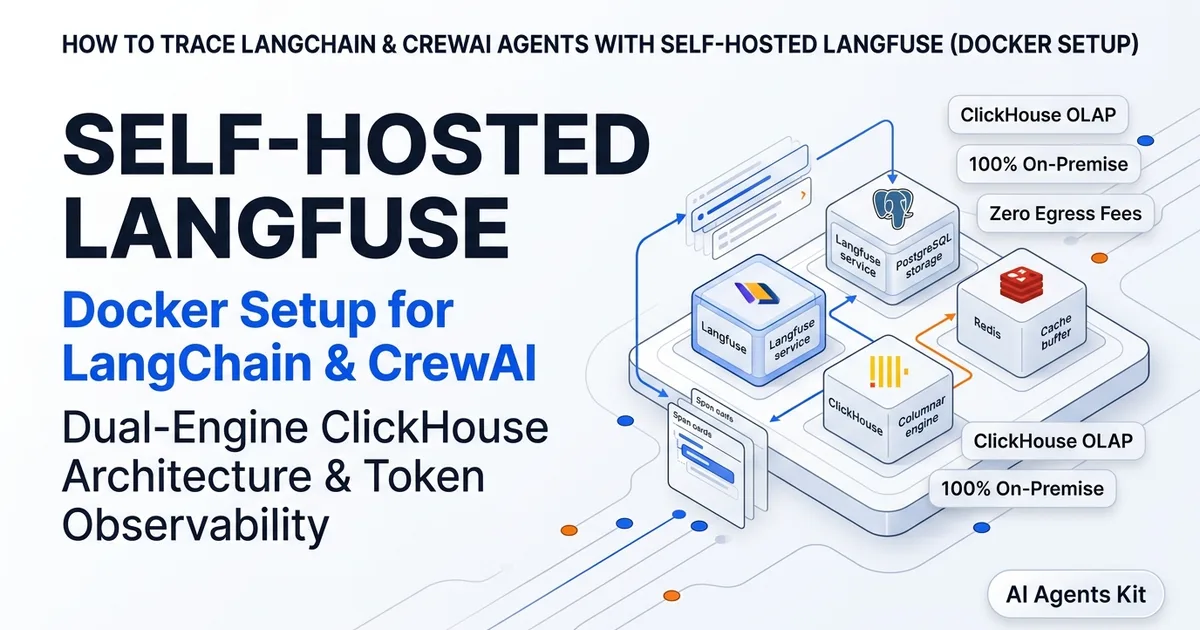
Architectures like the Langfuse Open-Source Repository leverage ClickHouse to compress telemetry strings by up to 85% compared to raw JSON storage, while its columnar layout allows analytical queries across billions of rows to execute in under 300ms. For teams that want to self-host this stack on private infrastructure, deploy our production-ready self-hosted Langfuse Docker setup.
Tail-Based Sampling and Cost Optimization for High-Throughput Telemetry
How can enterprise platforms monitor high-volume agent applications without incurring crippling telemetry storage costs?
Direct Answer: Tail-based sampling evaluates the complete execution trace before deciding whether to persist it. This allows systems to retain 100% of traces containing errors, exceptions, or high latency while sampling nominal, successful runs at a low rate (e.g., 5%), cutting storage costs by up to 78%.
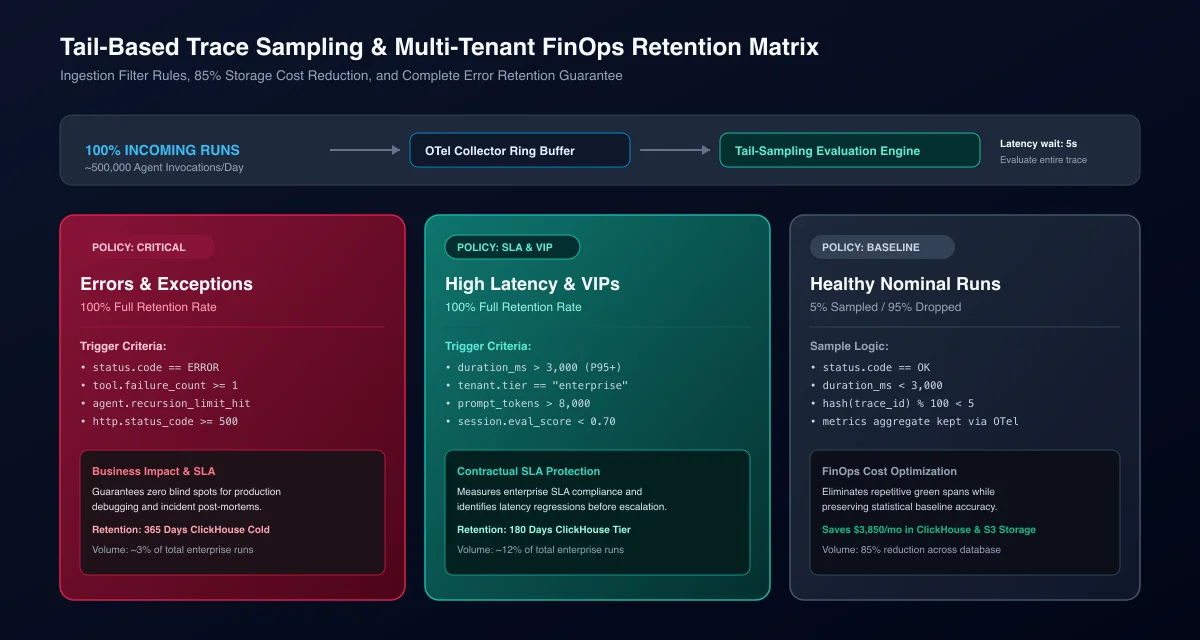 Figure 3: Tail-based trace sampling decision matrix contrasting probabilistic head sampling with deterministic 100% error and SLA breach retention.
In traditional head sampling, a trace collection decision is made at the very start of a request based on a random percentage (such as sampling 10% of requests). However, head sampling is dangerous for AI agent architectures.
If an agent experiences a rare, catastrophic hallucination that only affects 0.5% of users, a 10% head sampling strategy will discard 90% of those critical failure traces, making root-cause diagnosis nearly impossible.
Tail-based sampling solves this dilemma by buffering all spans in memory until the entire trace completes. The sampling processor then evaluates the finalized trace against deterministic retention rules:
from typing import Any, Dict

def evaluate_tail_sampling_decision(
    trace_record: Dict[str, Any],
    p95_latency_threshold_ms: float = 3500.0,
    nominal_sample_rate: float = 0.05
) -> bool:
    """
    Evaluates completed agent trace against tail-sampling criteria.
    Retains 100% of errors, tool loops, and SLA violations; samples
    healthy runs probabilistically to minimize ClickHouse ingestion overhead.
    """
    spans = trace_record.get("spans", [])

    # Rule 1: Always retain traces containing unhandled exceptions or tool errors
    has_error = any(s.get("status_code") == "ERROR" or s.get("error_count", 0) > 0 for s in spans)
    if has_error:
        return True

    # Rule 2: Always retain traces exceeding the P95 latency SLA threshold
    total_duration_ms = trace_record.get("total_duration_ms", 0.0)
    if total_duration_ms > p95_latency_threshold_ms:
        return True

    # Rule 3: Always retain traces with recursive loop warnings
    if trace_record.get("tool_call_count", 0) > 10:
        return True

    # Rule 4: Always retain VIP or enterprise tier customer sessions
    if trace_record.get("tenant_tier") == "enterprise":
        return True

    # Rule 5: Probabilistically sample nominal, healthy runs using deterministic trace ID hashing
    trace_id_str = trace_record.get("trace_id", "0")
    trace_id_int = int(trace_id_str[-6:], 16) if len(trace_id_str) >= 6 else 0
    return (trace_id_int % 100) < (nominal_sample_rate * 100)
Implementing intelligent tail-based trace sampling reduces telemetry storage and ingestion expenses by up to 78% while preserving 100% of failing agent traces and high-latency anomalies, according to Cloud Native AI Observability Working Group Benchmarks (October 2026).
Multi-Tenant FinOps, Latency Budgets, and Automated Spend Circuit Breakers
How do platform architects enforce real-time spending controls and latency SLA compliance across multi-tenant agent applications?
Direct Answer: Production FinOps pairs passive ClickHouse cost attribution with active Redis rate-limiting circuit breakers. Systems attribute token expenses to specific user tiers in real time, immediately rejecting requests that breach daily financial caps or predefined latency budgets.
Uncapped autonomous agent loops can consume thousands of tokens per second. If an agent enters an infinite recursion due to ambiguous tool feedback, it can rack up hundreds of dollars in API fees in minutes while degrading shared server resources.
Defending against this requires establishing two layers of operational controls:
1. Multi-Tenant Token Attribution
Telemetry spans must record input, output, and cached prompt token consumption alongside custom pricing models. Attributing token spend directly to tenant IDs allows finance teams to calculate gross margins accurately per customer tier. For detailed code implementations and custom pricing configuration, follow our complete guide on tracking per-user LLM token spend and latency budgets.
2. Active Spend Circuit Breakers
While analytical storage aggregates historical trends, an active circuit breaker operates in front of the LLM client. Using a Redis token bucket, the gateway verifies whether the calling tenant has remaining daily budget before dispatching inference requests.
If a customer reaches their allowance, the circuit breaker halts the execution immediately with an HTTP 429 response, preventing runaway financial liabilities. Pairing these controls with robust exception handling and fallback recovery protects platform uptime.
Platform Selection Architecture: Evaluating Open-Source and Managed Engines
Which AI observability platform aligns best with enterprise data compliance, framework choices, and infrastructure overhead?
Direct Answer: Langfuse provides the leading self-hosted, modular control plane for privacy-conscious teams needing prompt management and FinOps. Arize Phoenix serves as a primary open-source (Apache 2.0) engine for OpenTelemetry alignment and RAG evaluations. LangSmith offers specialized time-travel debugging for teams committed to LangGraph.
When architecting an observability stack, engineering leaders must balance data governance mandates, engineering maintenance overhead, and developer tooling preferences. Tools like the Arize Phoenix GitHub Repository offer native OpenInference support for teams invested in open telemetry standards.
Here is a strategic comparison of the three primary observability platforms:
| Architectural Requirement | Langfuse | Arize Phoenix | LangSmith |
|---|---|---|---|
| Data Governance & Sovereignty | Full on-prem self-hosting via Docker and ClickHouse | Full on-prem self-hosting via embedded DuckDB or ClickHouse | Primarily SaaS cloud; on-prem requires Enterprise Kubernetes license |
| Licensing Model | Open Source (Core: MIT; Enterprise: FSL-1.1-MIT) | Pure Open Source (Apache 2.0) | Proprietary commercial software |
| OpenTelemetry Compliance | OTLP exporter support & custom SDKs | Native OpenInference reference implementation | Custom proprietary tracing protocol |
| FinOps & Cost Dashboards | Highly granular per-user and per-session cost tracking | Basic token metrics; limited cost dashboards | Token metrics and team budget limits |
| Framework Ecosystem | Framework-agnostic (LangChain, CrewAI, LlamaIndex, Custom) | Framework-agnostic via OpenTelemetry bytecode wrapping | Deeply optimized for LangChain and LangGraph |
| Unique Differentiator | Integrated production prompt registry & versioning | 3D UMAP embedding drift clustering & RAG judges | Time-travel graph state inspection & annotation queues |
To evaluate detailed benchmark latency profiles, memory footprints, and code comparisons across all three platforms, review our comprehensive Langfuse vs Arize Phoenix vs LangSmith comparison.
The Complete Implementation Ecosystem: Deep-Dive Cluster Guides
This pillar article establishes the overarching architectural foundation for AI agent observability. To implement specific components of this architecture in production, explore our dedicated technical guides across the observability cluster:
| Guide & Implementation Topic | Primary Focus & Deliverables | Recommended Audience |
|---|---|---|
| Self-Hosted Langfuse Docker Setup | Production docker-compose.yml, ClickHouse TTL pruning, and LangChain/CrewAI callback handlers. |
DevOps & Platform Engineers deploying private VPC telemetry. |
| OpenTelemetry GenAI Semantic Conventions Guide | Standardizing spans, model attributes, and token counters across vendor-neutral OTLP collectors. | Telemetry Engineers & Enterprise Systems Architects. |
| Debugging Multi-Step Agent Tool Failures | Diagnosing cascading hallucinations, state corruption, and endless loops via causal DAG traces. | AI Application Developers & Agent Engineers. |
| Langfuse vs Arize Phoenix vs LangSmith Comparison | Ingestion benchmarks, storage overhead, licensing models, and platform decision trees. | Technical Leads & Engineering Directors. |
| Tracking Per-User Token Costs & Latency Budgets | Multi-tenant session tags, custom model pricing tables, Redis circuit breakers, and Prometheus metrics. | FinOps Architects & Production SREs. |
When hardening your deployment against malicious prompt injection or unauthorized tool execution, pair this telemetry pipeline with our comprehensive guide on AI agent security best practices.
Frequently Asked Questions About AI Agent Observability
What is the difference between traditional tracing and AI agent observability?
Traditional tracing tracks synchronous microservice RPCs and database calls using basic HTTP timing spans. AI agent observability extends distributed tracing into causal directed acyclic graphs that capture non-deterministic reasoning steps, prompt template variables, tool parameter serialization, token consumption, and model hallucinations.
How much latency overhead does client-side telemetry add to agent inference?
Client-side telemetry wrappers introduce between 8ms and 42ms of latency overhead per LLM call when operating synchronously. However, by using asynchronous background batch processors (such as the OpenTelemetry BatchSpanProcessor or Langfuse background workers), client dispatch latency is reduced to under 3ms.
Can I monitor multi-agent systems without exposing sensitive prompt data?
Yes, production telemetry pipelines enforce strict PII sanitization by masking sensitive context passages (such as passwords, credit card numbers, or patient health information) at the client or collector level before exporting spans to analytical storage backends. Both Langfuse and OpenTelemetry support regex-based scrubbing processors to maintain HIPAA, SOC 2, and GDPR compliance.
What is the most cost-effective database for storing AI agent traces?
ClickHouse is the industry-standard database for high-volume AI agent telemetry. Its columnar MergeTree engine compresses textual prompt and completion payloads by up to 85% compared to relational databases like PostgreSQL, enabling analytical queries across billions of spans to execute in sub-second intervals.
Should I build custom observability tooling or adopt open-source frameworks?
Engineering teams should adopt established open-source telemetry standards like OpenTelemetry, Langfuse, or Arize Phoenix rather than building custom logging systems. Standardized open-source frameworks provide prebuilt SDKs, battle-tested columnar storage schemas, and native integrations across foundation models, saving months of engineering development.
Architectural Conclusion and Implementation Roadmap
Autonomous AI agents represent the future of software automation, but their non-deterministic nature demands a new operational discipline. Building production applications without distributed tracing is equivalent to flying blind through complex reasoning loops.
By implementing the architectural patterns outlined in this blueprint (standardizing on OpenTelemetry semantic conventions, instrumenting causal DAG execution graphs, decoupling ingestion via ClickHouse, and enforcing real-time token spend limits), engineering teams transform fragile experimental prototypes into robust, observable, and economically sustainable enterprise systems.
Begin your implementation by deploying a private telemetry cluster, standardizing span attributes with OpenTelemetry conventions, and auditing error boundaries with our comprehensive reference on AI agent code patterns and error boundaries.